
Pley Analytics
This article is an overview of Analytics on Pley.
Analytics on Pley | Read MoreArticle: Implement Pley Analytics into your Unity game
Article: List of all Pley Analytics Events
Pley aims to provide all sorts of analytics for you to be able to run your game. Data is a requirement to run UA, improve your game, and gauge the overall performance. Events are created in multiple places and end up in two destinations to be utilized: Game Manager and Data Layer (which exports to any analytics service you prefer).
Data can be accessed in:
- Game Manager Analytics (High level, instantly accessible on manage.pley.com)
- The analytics service of your choice (Such as Amplitude for analytics or Singular for attribution)
Events are also generated from multiple places:
- Automatically through the Playable API (Purchases, Crashes, Game Loading, Performance Data, and more).
- Gameplay Analytics (Implemented in the game code through Pley SDK methods)
- Game Site (Page views, UTM data. Depends on the analytics service you work with.)
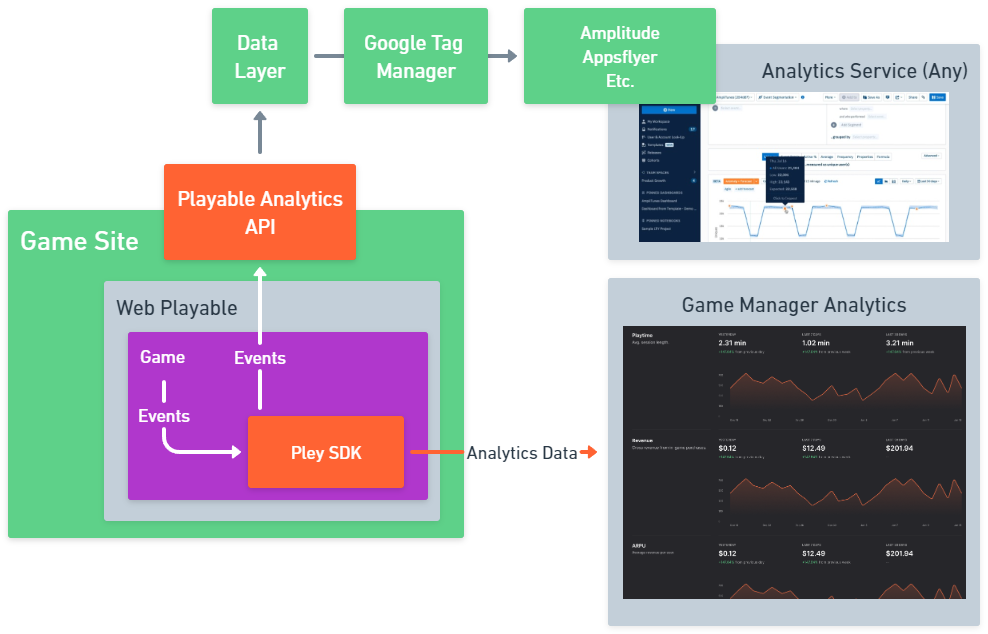
A diagram to show how data flows between dependent entities.
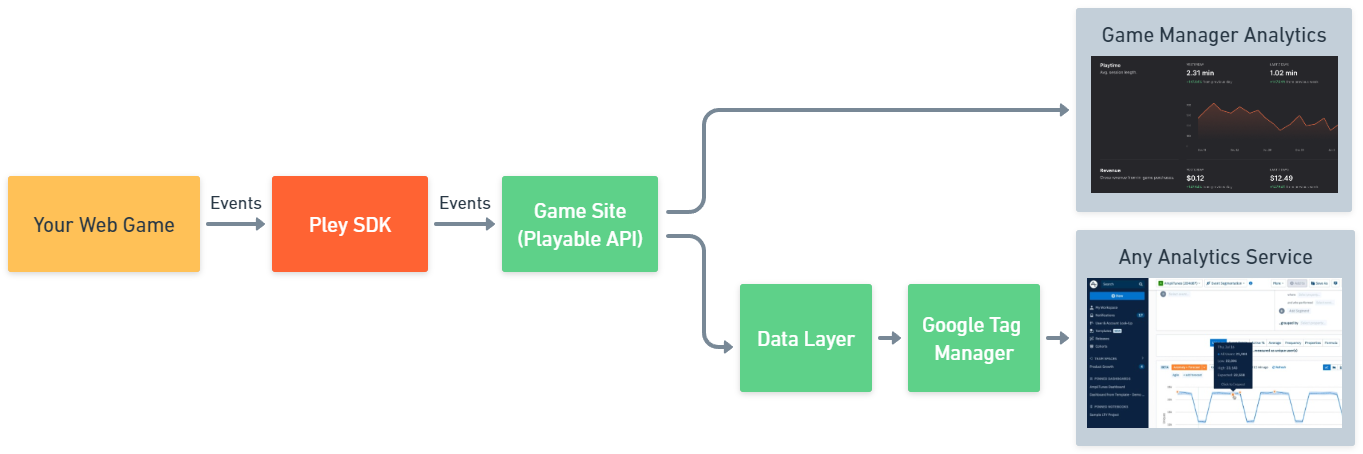
Diagram that shows how event data flows, ending up in the two destinations.
Game Manager Analytics
Within the Game Manager, you get access to a snapshot overview of your game. It is not meant to be an in-depth dashboard to run UA campaigns through, but as a pulse-check for how your game is doing.
You can find this information in the Game Manager, under Project > Analytics.
(For a more advanced dashboard, we recommend integrating with the analytics service of your choice, such as Amplitude. Read more about implementing that here)
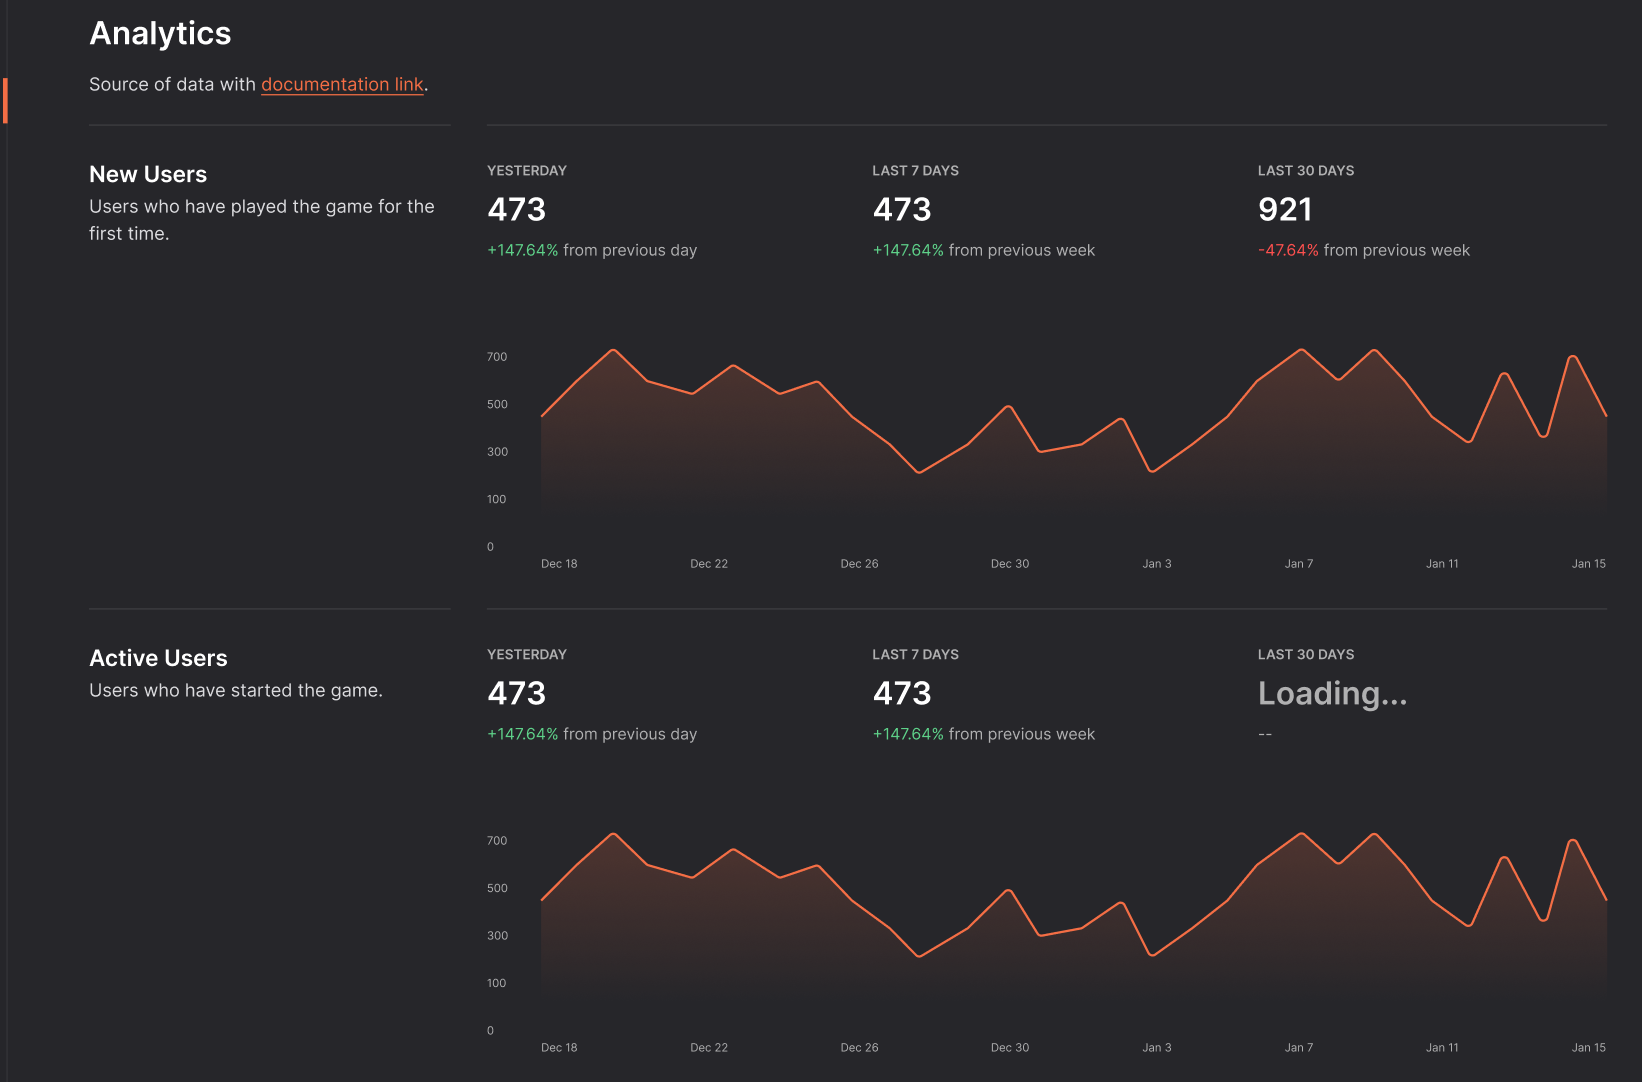
Game Manager Analytics Explanation
Source of TruthThe analytics in the Game Manager may be affected by users browser behavior, adblockers, and consent managers. Due to this, it cannot be treated as the source of truth. This is particularly true for revenue numbers where the payout and sales reports provided will be the truly accurate source.
Expect the data to be within +-5% of the real number, but be aware of its limitations.
New Users: How many users have started the game who hasn't played the game before.
Active Users: How many unique users have started the game.
Retained Users: Active users who also have played at least 7 days ago
Connected Users: How many users have expanded to cross-platform through Pley Connect by linking their Pley Account with their mobile progress.
Sessions Per User: How many sessions (on average) does each unique user have for each time interval.
Playtime: The average length of each session.
Revenue: Gross revenue from in-game purchases during each time interval.
ARPU: Average revenue per user.
ARPPU: Average revenue per paying user.
% of Sessions with Crash: What percentage of sessions experience crashes?
Startup Funnel: Conversion rate from pressing "start" to playing the game.
Web Browers: Breakdown of which are the most common web browsers.
Device OS: Breakdown of which device OSes are most common.
Distribution Channels: Breakdown of game distribution channels, such as gamesite, discord or crazygames.
Updated 6 months ago