Pley Web Debugger
It was impossible to debug Unity C# code with breakpoints on the web - until now!
Experimental FeatureWebGL translates your Unity C# code into WebAssembly, which normally is (mostly) unreadable. The Pley Debugger is an experimental feature that re-parses the WebAssembly back into C# - allowing you to debug and set breakpoints through the Google Chrome debugger (using their DWARF-extension).
Installing and Enabling the Web Debugging
1) Install Google Chrome. (Link)
2) Install the DWARF-Extension for Chrome (Link)
3) Open Chrome Developer tools (Right Click > Inspect OR ... > More Tools > Developer Tools)
4) Open the Chrome Developer Tools setting (⚙️-icon)
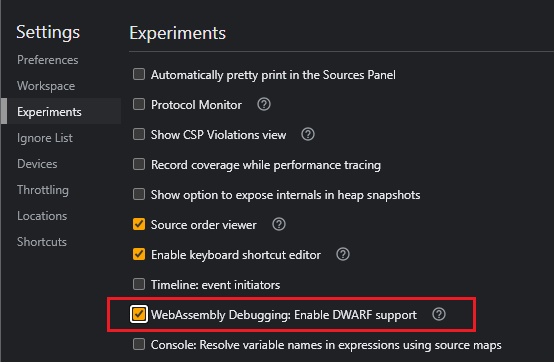
5) Click Experiments
6) Check "WebAssembly Debugging: Enable DWARF support"

Debugging in Chrome is only possible if DWARF is enabled!
Now you can use Chrome Debugging for Unity C# Projects!Pley's Post-Processing automatically sets everything up for you whenever you upload a game-build to Pley, so no action is required to enable Pley C#-WAsm Debugging!
Debugging WebAssembly With Modern ToolsChrome DWARF (Debugging WebAssembly with Modern Tools) is an experimental feature to debug web features using C, C++, and WebAssembly. Our tool extends it to C# Unity games as well.
Read more about it here!
Using the Debugger
Stub ArticleThis article is incomplete. If you want help, don't hesitate to reach out to us!
1) Confirm that DWARF is running in the web browser console.

You should be able to see those 2 logs in the developer console
Updated 7 months ago
